Growth & CRO
How we cut checkout abandonment from 73.1% to 53.9%
· Updated · 8 min read
S
Get CRO Checklist — 17 fixes
The 17-point checklist from the 73%→54% teardown. Same format, new numbers.
No spam, unsubscribe anytime. I only email teardowns.
· Updated · 8 min read
The 17-point checklist from the 73%→54% teardown. Same format, new numbers.
No spam, unsubscribe anytime. I only email teardowns.
Your cart abandonment rate is an aggregate, and aggregates hide the truth. Instrument every checkout step with GA4 custom events, watch real sessions in Clarity, and you'll usually find three separate problems where the board sees one. Fix them independently and you don't need to rebuild anything: at Sierra Living Concepts we cut abandonment from 73.1% to 53.9% (−26% relative) in two sprints, with zero architecture changes.
The number nobody needed to be reminded of was 73.1%. Everyone in the room knew it. It was in the deck, in the OKRs, in the quarterly review — cart abandonment: 73.1%, still red. What nobody in that room could tell you was why.
Because nobody had ever asked the funnel.
We had 480,000 sessions sitting in GA4 at Sierra Living Concepts — three full months of traffic, add-to-carts, purchases. And none of it could answer the simplest question in e-commerce: at which checkout step are people leaving?
The team was optimizing on aggregates plus folklore from support tickets. "Coupon not working" showed up in tickets regularly, so someone guessed coupons were the problem. "Shipping too expensive," said another batch of tickets, so someone else was lobbying for free shipping. Both were reasonable guesses. Nobody had a measurement that could settle it.
That's the thing about a cart-abandonment problem: it looks like a single problem. One dashboard number. One KPI to move. If you try to fix "abandonment" as one thing, you'll ship the wrong fix, again, and the number won't move.
By the way — if you're reading this and thinking "sure, but 73% is normal, Baymard says the industry average is around 70%," you're not wrong, and that's exactly the trap. Baymard's aggregate makes 70%+ look like the status quo. It is the status quo. Which is precisely why the aggregate is useless as a lever: nobody acts on a number everyone already agrees with. The moment we split ours into steps, we stopped optimizing a stat and started fixing encounters.
The resistant take I got the most, from people who'd been optimising the store for years: "we already know it's shipping." Maybe they did — but the fix they'd been discussing was free shipping for everyone, which is a margin conversation, not a checkout conversation. The team didn't need a hypothesis; it needed proof at the step level, and that proof only arrives once every step reports its own number. This is the boring truth at the heart of the project: most of the effort was building the dashboard.
The first call was the one I'd defend in every project from then on: don't change a single pixel until the funnel can talk.
I set up GA4 custom events on every checkout step — cart view, shipping information, payment information, order review, purchase. Until then, nothing below added to cart was measured.
Then I layered Microsoft Clarity on top, and did the part most CRO blog posts conveniently stop before: I watched 50 full sessions by hand, across desktop and mobile, at 2x speed, taking notes. Not heatmaps. Not aggregates. Actual humans clicking, hesitating, and leaving.
Here's the instrumentation I mean, in plain terms. If you've never done it, this is the whole recipe:
// GA4 custom events — fire these on each checkout step transition
dataLayer.push({ event: 'checkout_start',        step: 'cart' });
dataLayer.push({ event: 'checkout_step_view',    step: 'shipping',     step_index: 1 });
dataLayer.push({ event: 'checkout_step_view',    step: 'payment',      step_index: 2 });
dataLayer.push({ event: 'checkout_step_view',    step: 'review',       step_index: 3 });
dataLayer.push({ event: 'checkout_completed',    value: cartTotal,     currency: 'USD' });
That block is more valuable than any tool this post will mention. Custom events per step are the one thing that turns a flat abandonment rate into a genuinely readable staircase.
Cross-referencing GA4's step drop-off with Clarity's rage-clicks, three distinct clusters surfaced within two weeks:
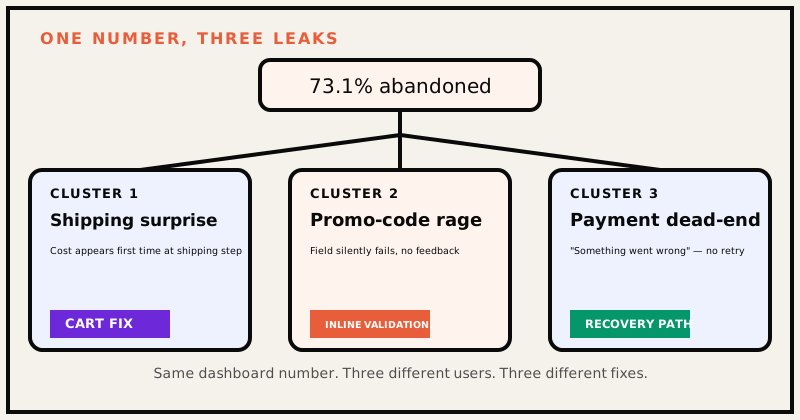
Each got an independent fix. That separation — one metric split into three stories — is the whole lesson of the project. In the aggregate the leaks looked identical. On the session recordings they were three different people quitting for three different reasons.
Six weeks, two sprints, zero architecture changes. The checkout template in Shopify Plus never changed. We only improved execution quality at each step.
Fix 1 — Shipping cost on the cart page. Show the complete total before someone enters checkout. Shipping cost shouldn't be a surprise at the shipping step — it should be visible while the user is still deciding. We moved it to the cart page so the real number was known before commitment. This was the leak that hurt most in the sessions: users arrived at shipping, saw the number jump, and back-buttoned out in under three seconds. No hesitation. No wonder. Just exit.
Fix 2 — Promo code inline validation. The promo field had been failing silently. We added inline validation that says exactly what's wrong — wrong format, expired code, or ineligible category — the moment it's typed, instead of silently swallowing the error on submit. Rage-clicks on that field were the loudest single signal in Clarity; five of those sessions played back-to-back justified the build all by themselves.
Fix 3 — Payment error recovery. Generic "something went wrong" became specific copy — card type, expiry, or network decline — plus a visible retry path. The user is no longer stranded in a dead end. This one had the clearest before-after: sessions that used to die on the error screen started one-tap retrying to completion.
Each build was validated in isolation. We didn't A/B the whole funnel as a black box; we tested each fix, then stacked all three. That sequencing mattered more than the fixes themselves — when the number moved, we knew exactly which change owned it.
| Metric | Before | After |
|---|---|---|
| Cart abandonment | 73.1% | 53.9% |
| Mobile conversion rate | baseline | +47% |
| Checkout completion | baseline | +49% |
| Sessions analysed | 480,000 | GA4 + Clarity |
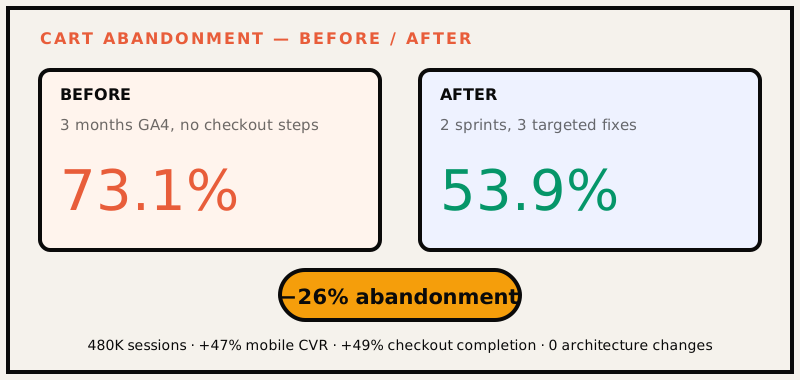
The fixed checkout also beat Wayfair's mobile checkout benchmark within 30 days of the final sprint — a comparison that usually only gets made in hindsight.
The template stayed the same. The checkout didn't need to be rebuilt. It needed to be measured.
Let me put the metrics in context, because "73.1% → 53.9%" can read like a sales pitch. Relative to the ~70% Baymard category average, we weren't just meeting the benchmark — we ended up roughly 16 points below it, with the band of abandoned carts shrinking by more than a quarter. And while the +49% completion and +47% mobile CVR sound like dashboards work, on a US D2C furniture store in the mid-five-figure AOV bracket, both convert straight into recovered orders. That's why this ended up prioritized as a revenue story, not a CRO curiosity: same storefront, same traffic, recovered orders.
If this teardown reduces to twelve words: the rate is real, the aggregate is the lie. The causes live beneath the number, in encounters — a total you can't see in time, a promo code that eats your input, an error you can't recover from. The reasons I actually find in practice, in rough order of frequency:
Each of these takes a different fix, which is the whole point: the aggregate can't give you the split, and the split determines the prescription. Nothing on a flat GA4 event list tells you whether price opacity or silent failure is bigger until you build the step events and then actually watch the people.
Let me not pretend this was a clean case. There are three things I'd change if it reset:
Turn on session recordings from day one — not after the custom events. We had three months of GA4 data we couldn't read because nothing below add-to-cart was tracked. Two weeks of Clarity recordings produced more actionable insight than the entire quarter of aggregates. If I do it again, the first commit is instrumentation, in week one, not week three.
Map external benchmarks to your own checkout before shipping. Baymard's research had been sitting in a folder for months. It's genuinely useful — but only once you've mapped every violation to your specific flow. Copying their checklist onto a different implementation is how you end up shipping changes that don't move the number.
And the awkward one: the support-ticket theory was almost a trap. The "coupon problem" everyone believed in was real but secondary. The real root cause was the surprise shipping cost. The dashboard couldn't have told us that; the tickets actively misled. The truth only came out when we watched users actually do the thing.
Full teardown with the charts and the numbers lives in the cart & checkout case study — and this post is the anchor case behind all my CRO work. The general method is written up in the data deep-dive, and the cadence that shipped these fixes is one fix a week.