Product Management
Daily report automation: 3 sources, 88 rows, 11 AM
· Updated · 4 min read
S
Get AI Workflow Teardown Template
The template I use to map AI workflows before writing a spec.
No spam, unsubscribe anytime. I only email teardowns.
· Updated · 4 min read
The template I use to map AI workflows before writing a spec.
No spam, unsubscribe anytime. I only email teardowns.
Daily reporting is 90% ritual, 10% signal. For the team at LiveKeeping we built a Google Apps Script pipeline that unifies Kibana, MongoDB, and GA4 into one auto-populated report — 88 mapped rows, delivered at 11 AM with zero manual steps. The automation wasn't the win; the agreed shape of the report was.
Three tabs. One formula fight. One Slack paste. Thirty minutes, every morning, for whoever drew the short straw. Multiply by a working year and the "quick morning report" quietly costs a hundred-plus hours nobody budgeted — invisible in product metrics, present every single day. We killed it in a week with Google Apps Script, and the code was the least interesting part.
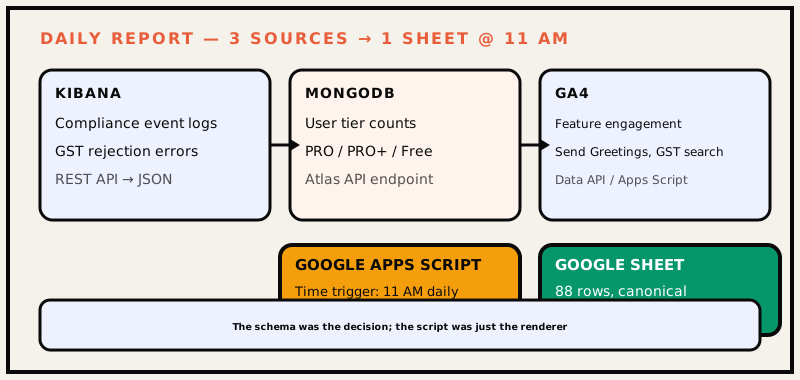
The first version had raw API calls sprinkled through the main script. When Kibana's Elasticsearch DSL changed, the whole pipeline broke. The fix: every source sits behind a tiny adapter — a single file with one contract: fetchData() → normalized rows[].
// adapters/kibana.js
function fetchKibanaData() {
  const resp = UrlFetchApp.fetch(KIBANA_ENDPOINT, { headers: { Authorization: `Bearer ${KIBANA_TOKEN}` } });
  const raw = JSON.parse(resp.getContentText());
  return raw.hits.hits.map(hit => ({
    date: hit._source['@timestamp'],
    errorCode: hit._source.error_code,
    product: hit._source.product_module,
    merchantTier: hit._source.tier,
    count: hit._source.count
  }));
}
When Kibana changes, you edit one file. The main orchestrator doesn't know Kibana exists — it just calls adapters.kibana.fetchData().
MongoDB adapter — uses the MongoDB Data API (not a direct driver, since Apps Script can't hold connections):
// adapters/mongodb.js
function fetchMongoData() {
  const payload = {
    dataSource: "LiveKeepingCluster",
    database: "analytics",
    collection: "user_tiers",
    pipeline: [
      { $match: { date: { $gte: yesterdayStart, $lt: todayStart } } },
      { $group: { _id: "$tier", count: { $sum: 1 } } }
    ]
  };
  const resp = UrlFetchApp.fetch(MONGO_DATA_API_URL, {
    method: "post",
    headers: { "Content-Type": "application/json", "api-key": MONGO_API_KEY },
    payload: JSON.stringify(payload)
  });
  return JSON.parse(resp.getContentText()).documents;
}
GA4 adapter — uses the GA4 Data API with a service account:
// adapters/ga4.js
function fetchGA4Data() {
  const token = getServiceAccountToken(); // cached 1hr
  const resp = UrlFetchApp.fetch("https://analyticsdata.googleapis.com/v1beta/properties/123456:runReport", {
    method: "post",
    headers: { Authorization: `Bearer ${token}`, "Content-Type": "application/json" },
    payload: JSON.stringify({
      dateRanges: [{ startDate: "yesterday", endDate: "yesterday" }],
      dimensions: [{ name: "eventName" }, { name: "country" }],
      metrics: [{ name: "eventCount" }],
      dimensionFilter: { filter: { fieldName: "eventName", inListFilter: { values: ["send_greeting", "gst_search"] } } }
    })
  });
  return JSON.parse(resp.getContentText()).rows.map(r => ({
    event: r.dimensionValues[0].value,
    country: r.dimensionValues[1].value,
    count: parseInt(r.metricValues[0].value)
  }));
}
Before any code, we sat down with the PM, the analyst, and the CTO and agreed on exactly what each row means. The schema doc:
| Row | Metric | Source | Grain | Owner |
|---|---|---|---|---|
| 1–12 | GST rejection errors by code | Kibana | Daily | Compliance PM |
| 13–18 | User tier distribution | MongoDB | Daily | Growth PM |
| 19–30 | Feature engagement (Send Greetings, GST search, etc.) | GA4 | Daily | Feature PMs |
| 31–88 | Tier and region drill-downs of the above | All three | Daily | Shared |
The script just renders this agreement. When a stakeholder asks "why is row 23 that number?", the answer is in the schema doc, not the code.
The pipeline runs at 11 AM. If it fails, the team knows by 11:05. Here's how:
// main.gs — orchestrator with alerting
function runDailyReport() {
  const startTime = Date.now();
  const results = {};
  const errors = [];

  for (const source of ['kibana', 'mongodb', 'ga4']) {
    try {
      results[source] = adapters[source].fetchData();
      Logger.log(`${source}: ${results[source].length} rows in ${Date.now() - startTime}ms`);
    } catch (e) {
      errors.push({ source, message: e.message, stack: e.stack });
      // Alert immediately via Slack webhook
      slackAlert(`🚨 Daily report: ${source} failed — ${e.message}`);
    }
  }

  if (errors.length === 0) {
    writeToSheet(results);
    slackAlert(`✅ Daily report ready at 11 AM — ${Object.values(results).flat().length} rows written`);
  } else {
    slackAlert(`❌ Daily report FAILED: ${errors.map(e => e.source).join(', ')}`);
  }
}
Three failure modes we've hit:
| Metric | Value |
|---|---|
| Sources unified | 3 (Kibana, MongoDB, GA4) |
| Rows mapped | 88 (canonical schema) |
| Delivery | 11 AM daily, auto-populated |
| Manual steps | 0 |
| Team on-call | removed |
| Cost item | Monthly | Notes |
|---|---|---|
| Apps Script runtime | $0 | Free tier covers 6h/day; we use ~15min |
| MongoDB Data API | $0 | Free tier (1M ops/month) |
| GA4 Data API | $0 | Free tier |
| Slack webhook | $0 | Incoming webhook |
| Engineering time (build) | ~16 hrs | One-time |
| Engineering time (maintenance) | ~30 min/mo | Token refresh, schema tweaks |
The "free" tier covers us completely — Apps Script quotas allow far more runtime than a 15-minute daily job needs. The real cost is the design time — agreeing on the 88 rows took 3 meetings, 2 hours each.
Automation doesn't remove the work. It removes the daily disagreement about what the work means. That's the part worth paying for.
--dry-run flag that logs what would be written without writing it would've caught the Kibana schema drift a week earlier.Deep dive here: the daily report automation case study. If you live in metrics-heavy B2B, my compliance gap diagnostic is home data hunting — the same habit of watching the numbers actually flow.